
A PDF version is available here.
This lockdown business, followed by my chemo etc., has played havoc with my bridge visiting. That does, thus, push me in to writing up more of the 1980s bridge tests. So let’s go to Torksey. Not many pictures, I am afraid, it was a chilly day.
Torksey, in Lincolnshire, is the site of a much more famous railway bridge over the Trent but we were there to observe a test of a small brick arch over a drain. It was the depths of winter (well, November) and never seemed to get properly light.
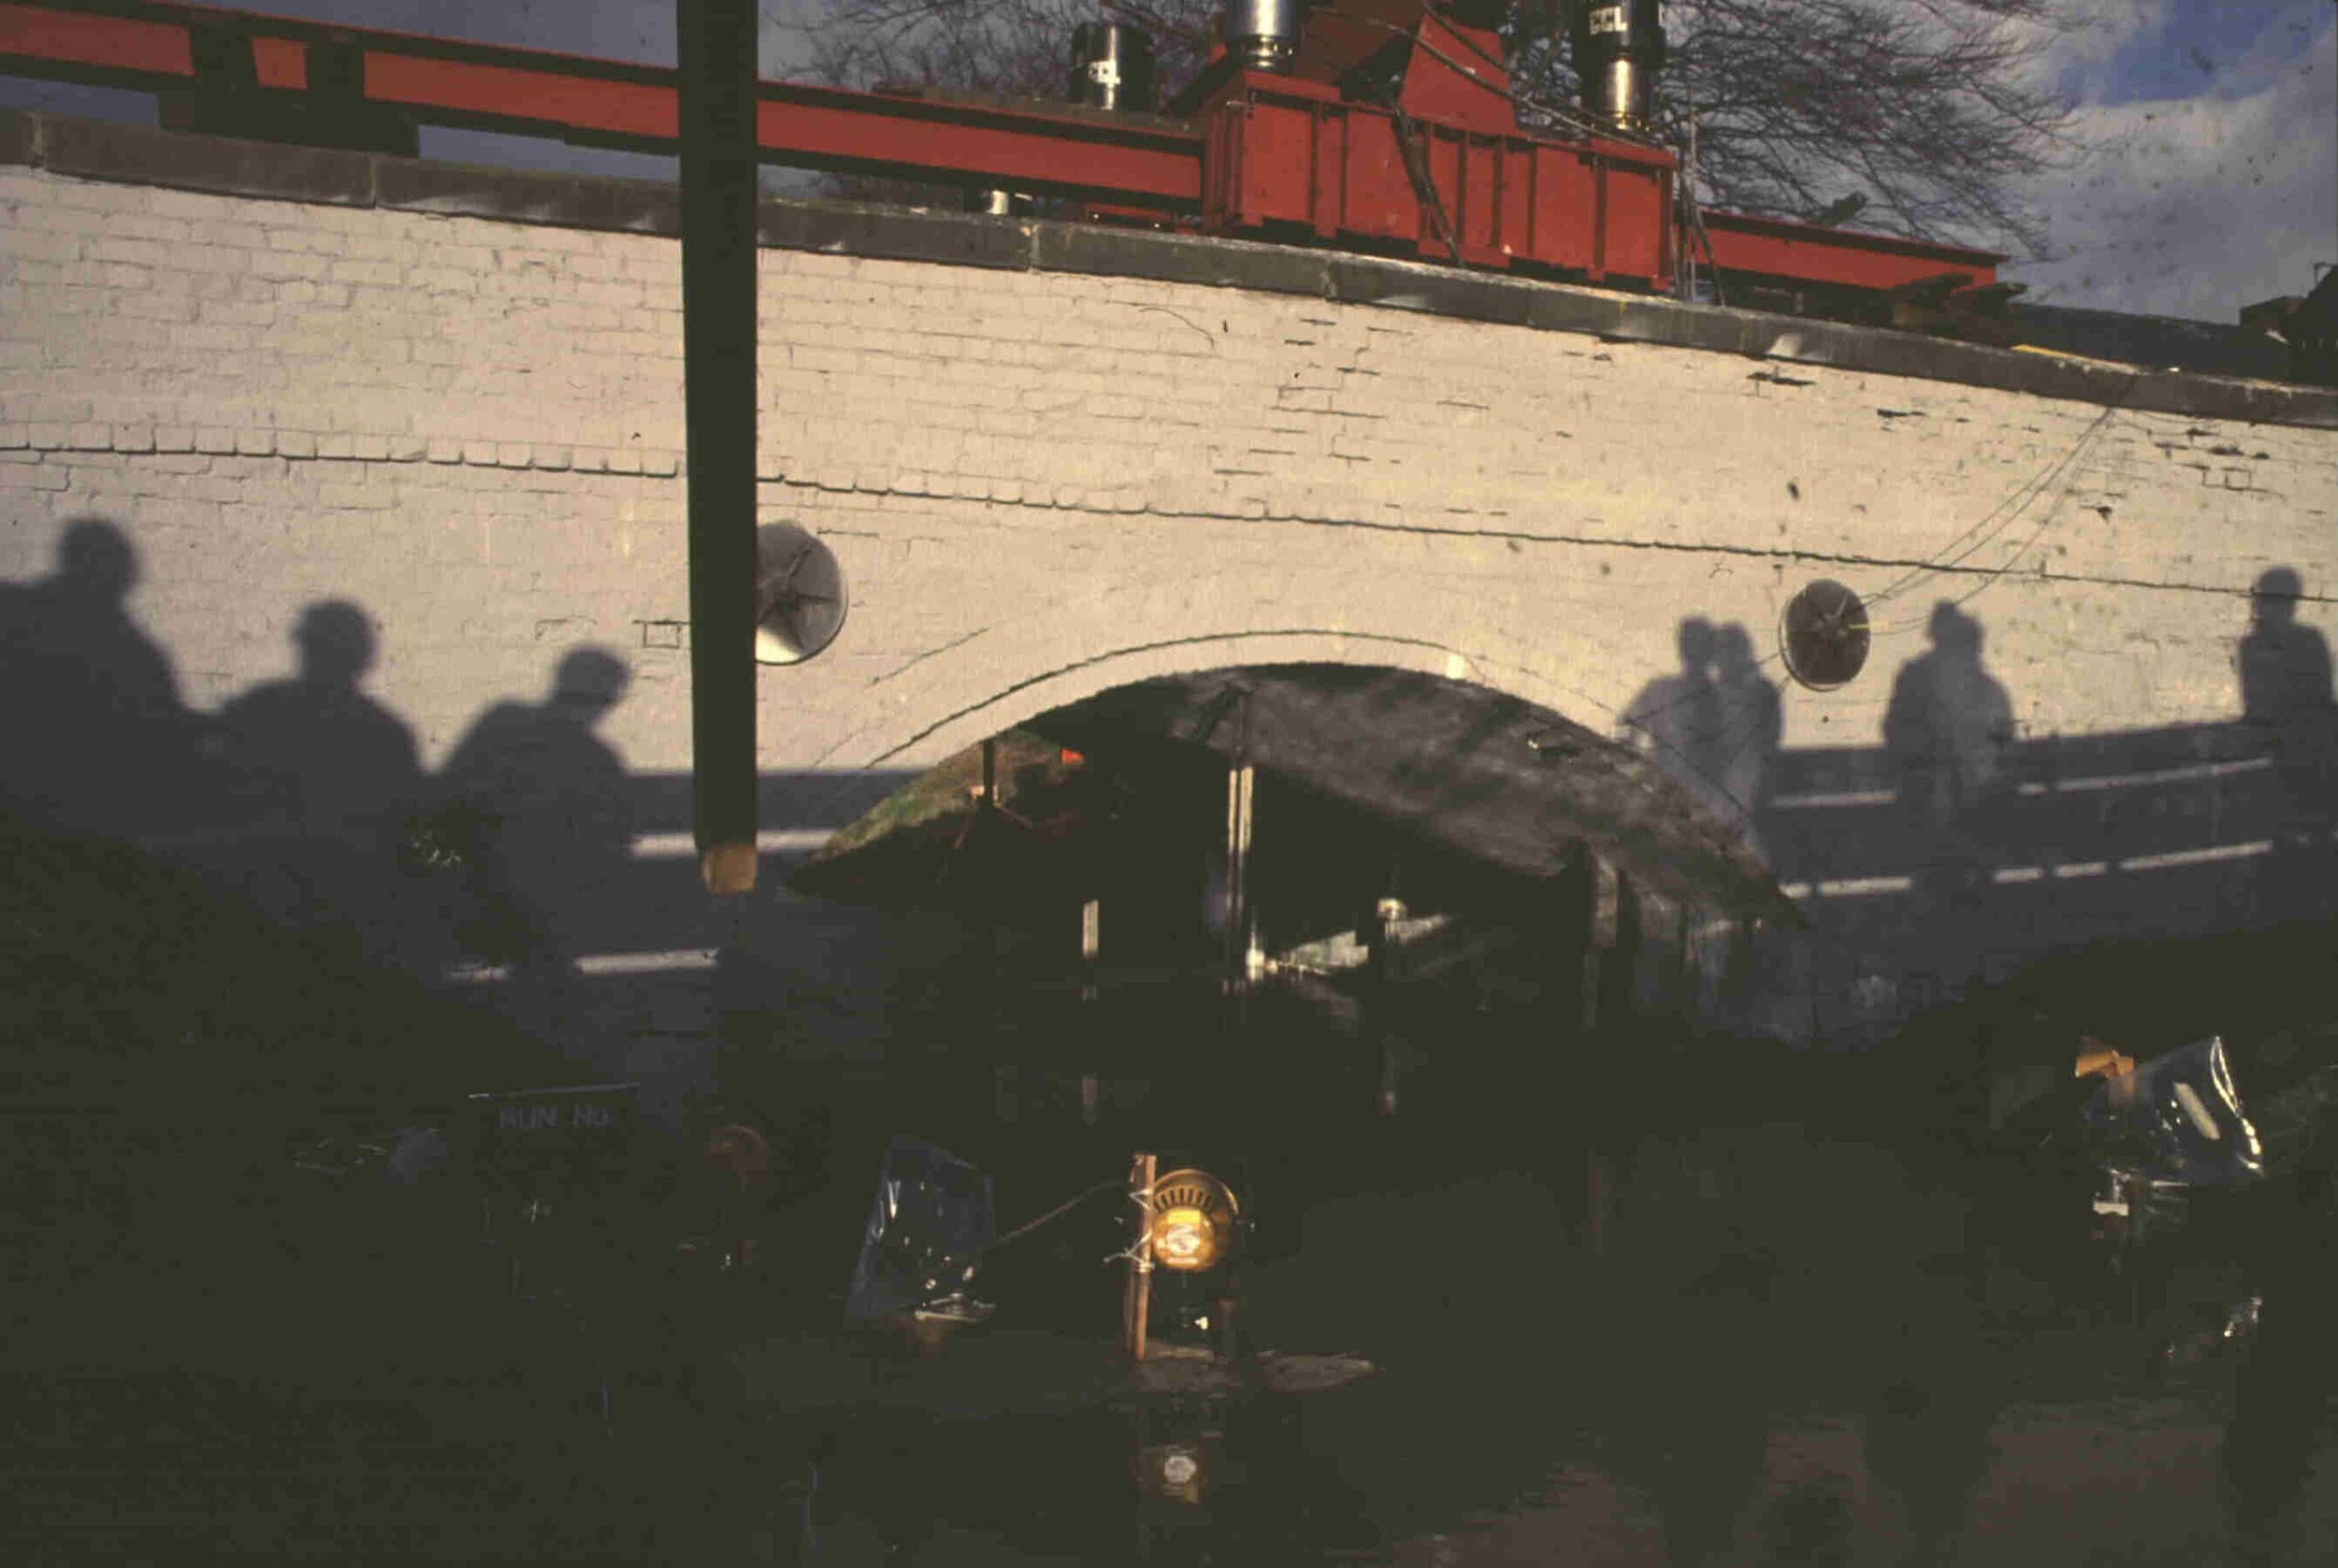
Nearly everything in that view is relatively new work. The arch itself is original but the wall, and the ring that supports it are in modern brick. As a result, the test was as close to 2D as it is possible to get in the field.
The TRL report notes that “Both spandrel walls had moved outwards, taking the outer sections of the arch with them.” A look at the photo below tells us that the inner face of the arch ring at this point is clean brick ends, not broken brick. We can deduce that the walls were taken right off, or perhaps collapsed, and a new ring was built to support the new walls. The face is remarkably smooth through the full depth, which is why I say then arch is likely to have behaved as 2-dimensional.
Also visible (just) in this photo is the backing above the arch. That will have made a substantial difference to behaviour as I will discuss later.

The only other photo of value comes from the TRL report and shows the arch in the process of collapsing.

The ring separation is obvious here but when did it happen? Almost certainly after the peak of the load deflection curve.
Values are presented for a “Mechanism Analysis” done in house by the late, lamented Mike Chrisfield. The table suggests that the mechanism forms at higher loads than the test showed for all but the lowest values of material strength and fill stiffness. That needs some discussion and I propose to look at that next.
First, an almost pure mechanism. With the material strength set at 30MPa we get a line of thrust not a zone.

Reducing the material strength to 2.5MPa reduces the capacity dramatically, though unlike Chrisfield’s program, Archie doesn’t allow the use of full passive pressure. The load here is reduced to 810kN at failure, against Chrisfield’s 1043kN.
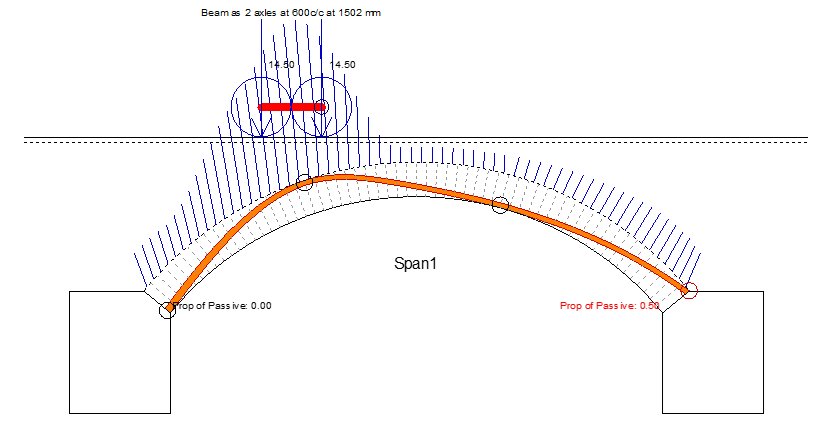
I should note here that I have represented the loading beam as two discrete loads 600mm apart. The distribution here is the standard allowed by Archie which is almost certainly over generous with such shallow fill. Reducing the distribution changes the picture a little.

With the narrower distribution the capacity drops further to around 720kN.
Now let’s look at the effect of backing.
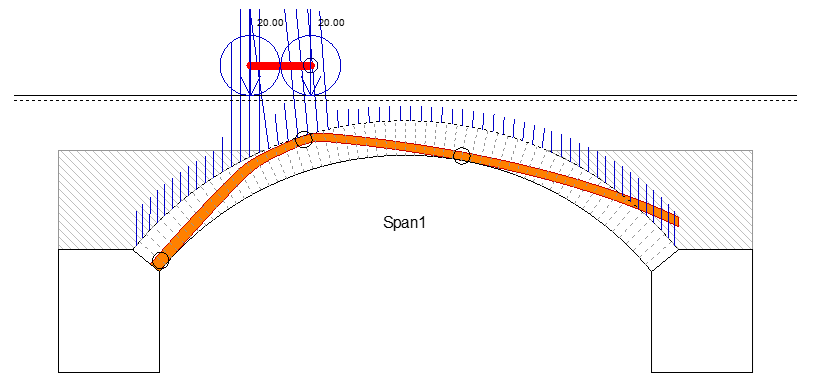
Notionally, that’s a no fail but we need to think a bit more about it. The first thing to note is that the back edge of the loading beam is over the backing. Then we can look at the implied stress patterns of this thrust. This is a new feature in Archie, yet to be released.

Over the middle portion of the arch, the stress moves from entirely in the top ring to entirely in the bottom over about 1.5m. The shear stress is distributed over about 1m. Calculating from the stress changes yields a peak shear stress between rings of 0.23MPa, but there will also be a contributory peeling effect as the radial crack opens through the stepped joints from ring to ring.
All that leaves us with the question “What, if anything, can we extract from this test?”
One worthwhile thing is not look at load deflection curves, though in this case they are sparse. There is no record of the zero load case, or even of the result of preload from the testing equipment, which was 26 tonnes, already double a normal traffic load. The deflections are recorded at zero with the load at 42 tonnes. The increments then go 52, 70, 86, 96, and 108 tonnes. The deflection curve under the load is shown below.

Here I have plotted the maximum load at each increment. The bridge then relaxed a little while the deflections were being measured. Regardless of that, we can surely say that something serious happened at a little over 800kN, and possibly something else at around 700kN.
If we had the fall back loads at each increment, the picture changes somewhat. Now we can say that the bridge really did not want to sustain a load over 830kN and crept from 10mm to 30mm deflection under that load.

Assuming the lower load at each increment rules clarifies the picture further.

Now there is a clearer transition at about 650kN and the upper one is surely at 830kN. Once the deflection reached about 35mm the capacity began to reduce (as might be expected in a structure where shape is critical). The final sustained load of 335kN indicates where ring separation led to total collapse.
As a final contribution I would add a map of deflections against position showing how the bridge as a whole deforms.

Note that the abutment movements are very small. The abutment under the load settles noticeably (12.3mm) under the maximum load but recovers to only 2mm deflection once the load is removed. The fact that the load point deflection to the right (left in the photographs) increases as the load increases indicates that the points being measured are to the right (mid span side) of the crack.
The measured point away from the load was positioned on the assumption that the arch was just an arch and would form a four-hinge mechanism at failure. In the event, this point pushed largely to the right until the peak load was passed and then lifted considerably, 20mm compared to the 17mm drop at the load point.
If the rising hinge is close to the crown, as suggested by the last thrust line picture above, perhaps around the 3m mark in the plot, it will have risen considerably more than the 20mm shown here. A still photo of the bridge at the 830kN load would have been invaluable in interpretation.
Some comments
On testing generally
Testing requires much more than just applying the loads, measuring the deflections and writing them down. The greatest value in a test is when the results, as here, are a bit surprising. When that happens (as it nearly always will in the field) you need vast amounts of data to allow a decent interpretation. I think I have squeezed a little more out of this than the TRL report did, but nowhere near as much as if there had been more, more frequent measurement.
The investment in this test was about £100k in 1986, which would be about £320k today. Over the relatively short period of the test, we could today transmit deflections by wire to points where the gauges would not be in danger and measure them synchronously at say 100 times per second. We would still want to load slowly but we could display the load deflection curves as they developed and spot changes very quickly. The speed of reading would mean we could effectively work in many more increments of load in even a short day.
On this test
This was the fifth such test carried out in the series, the third done entirely by TRL. Below I show the drawing of the test layout and my interpretation of hinge positions.

Note how close to the abutment face the near ground anchor is. This makes it quite surprising that the abutment went down under load. The red line is the falling hinge with a dot at the end that remains in contact. The blue line is the rising hinge. The rising hinge might be closer to the crown, the falling hinge is unlikely to be closer to the abutment but the large horizontal movement in the gauge points suggest that they are on the crown side of the crack. The right-hand fixed hinge on the intrados might have been located close to the bore holes for the ground anchors. The left-hand fixed hinge might be close to the top of the backing but the fact that gauges 11, 12 and 13 show distinctly upward movement, it must be closer to the end than that by some margin, perhaps at the closest point to the tie rod.
This diagram doesn’t show the arch backing. Even if we assume the arch is the critical structural element, backing is significantly stiffer than soil and will have a marked effect on behaviour. Backing is mentioned in the report, but at no point is then level or nature of construction noted.
In 1986, potentiometers were available for about £30 which would have measured deflections faster and to much higher accuracy than the surveyors. Sacrificing perhaps 30 of them would have cost less than employing the surveyors and delivered better results in real time. I find the maxim “the best is the enemy of the good” telling in these circumstances. Lab-based technicians will hear of nothing but LVDTs which are expensive to buy and expensive to read. Granted they have much greater temperature stability than potentiometers, but potentiometers are vastly to be preferred over survey measurement. Indeed, for the same price, several potentiometers will nearly always be better than one LVDT.
Retaining data: it has to be acknowledged that storing data was much more expensive 40 years ago but discarding the photographs from these tests is hard to forgive. Even the more detailed in-house reports seem to have been destroyed.
Perhaps the most pernicious outcome of these tests is the way they were presented in BA16, the Highways Agency Advice note on bridge assessment. All that appeared there were the bald statement that no bridge suffered damage at loads less than half the ultimate, coupled with the implication that the ultimate loads were a fair representation of the capacity of the bridges. Even at the time of publication, neither of those statements was remotely defensible and yet many academic analysts in the intervening years have presented results which compare only with those ultimate loads, without ever going back to the more detailed reports.
The underlying question is “IS IT A FAIR TEST” and even for this most 2D of bridges, the answer is emphatically no!
I will try, over the coming months to present my own review of the remainder of the tests.